by Wessel Wessels | Sep 6, 2019 | General
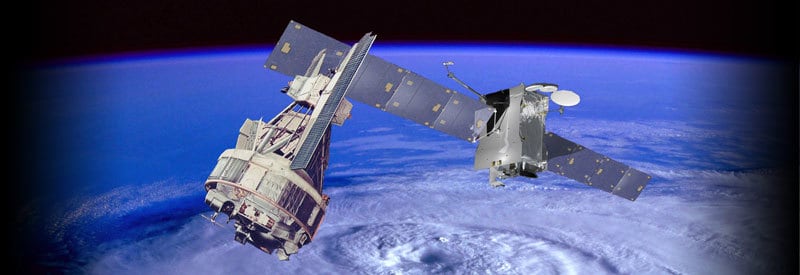
Defining A Weather Satellite – What It Is And How It Works Defining A Weather Satellite - What It Is And How It Works More than 8 000 man-made satellites currently orbit Earth, of which 4 853 are still active. They serve a wide range of purposes, including studying...
by Wessel Wessels | Sep 1, 2019 | General
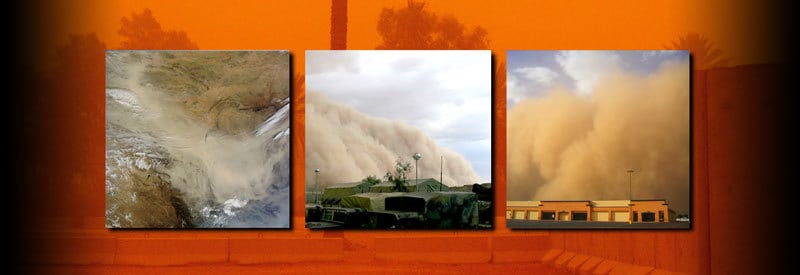
Dust Storms – What They Are And How They Develop Dust Storms – What They Are And How They Develop Readers residing in arid or semi-arid regions, which are characterized by loose, dry soil, will be very familiar with dust storms. However, this meteorological event...
by Wessel Wessels | Aug 29, 2019 | General
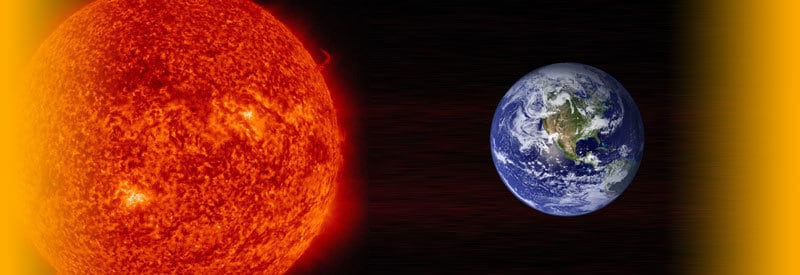
Solar Radiation – What It Is, How It Occurs, And The Different Types Of Radiation Solar Radiation – What It Is, How It Occurs, And The Different Types Of Radiation It would be safe to say that every reader knows what sunlight is, something we experience every day. The...
by Wessel Wessels | Aug 25, 2019 | General
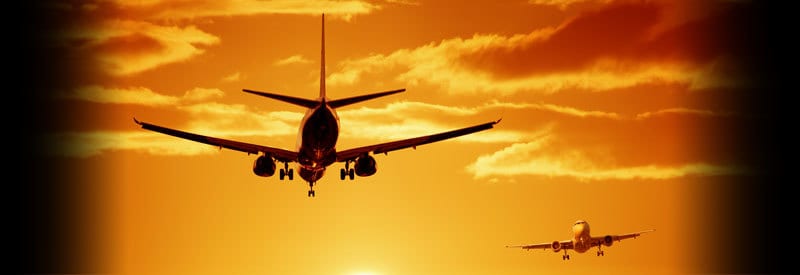
The Weather’s Impact On Aviation – And The Most Frequently Asked Questions About Weather And Air Travel The Weather’s Impact On Aviation - And The Most Frequently Asked Questions About Weather And Air Travel Frequent flyers or tourists using air travel to a remote...
by Wessel Wessels | Aug 22, 2019 | General
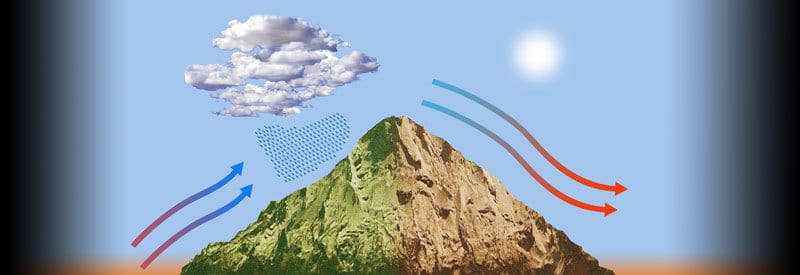
The Orographic Effect – What It Is And Its Impact On Weather Conditions The Orographic Effect – What It Is And Its Impact On Weather Conditions Many readers will be familiar with the impact of warm and cold fronts, wind, and other events on weather conditions. A...
by Wessel Wessels | Aug 19, 2019 | General
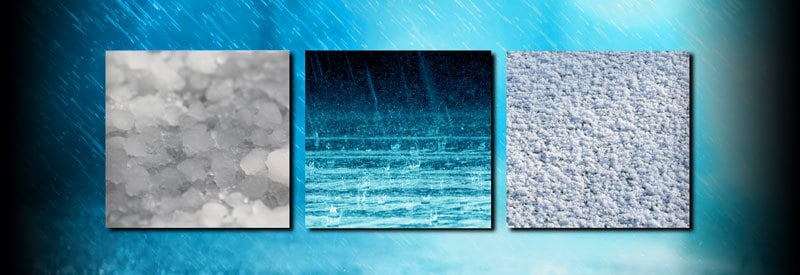
Defining Precipitation – What It Is And How It Occurs Defining Precipitation – What It Is And How It Occurs When you hear the word precipitation, one normally tends to think about rainfall, or water in its liquid state. In truth, precipitation is the umbrella term for...