

Dew Point - What It Is And Its Impact On Weather Conditions
Dew Point – What It Is And Its Impact On Weather Conditions

You often hear the term “Dew Point” mentioned during a weather forecast or meteorological discussion. We take a closer look at what dew point is, how it is reached, and its effect on the weather.
Whether it is the large-scale formation of clouds in the atmosphere or the droplets forming on the outside of a glass of cold water, it all occurs when temperatures reach or fall below the dew point.
This article examines what exactly dew point is and how it is formed. It also takes a closer look at the relationship between dew point and humidity.
What Is Dew Point?
During the introduction, you already received a brief description of what dew point is. To better understand its characteristics and development, though, one needs a more detailed and thorough definition of this meteorological event:
Dew Point Definition
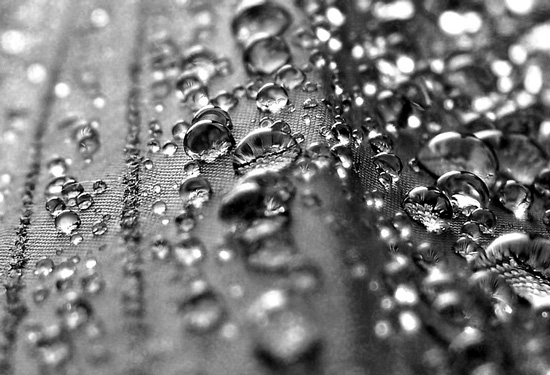
Dew point is defined as the temperature at which air becomes saturated with water vapor and condensation begins. This results in water vapor turning into liquid water or, under sufficiently cold conditions, directly into ice.
When dew point occurs at ground level, water droplets form on plants and other objects in the form of dew. Hence the term dew point.
The same process happens higher up in the atmosphere, where clouds form as the air temperature drops to the dew point.
Basically then, the clouds we see in the sky, as well as the dew we see on the ground in the mornings, are essentially one and the same thing. Especially when you consider the way in which they are formed.
(Clouds are nothing more than water vapor that has reached dew point and formed small water droplets as a result. After all, it is these small water droplets that make clouds visible in the first place.)
How And When Dew Point Is Reached
Understanding what dew point is may not be that difficult. All the variables and conditions that need to be in place, however, are not that simple and need some explanation.
Let’s first have a look at how dew point is reached. In order to do this, first understand that dew point is very closely linked to relative humidity. (To find out more about humidity, you can read all about it in this article.)
For the sake of this argument, let’s assume the barometric pressure and volume of air are constant and do not change in this scenario. Now let’s say the relative humidity is 50% at 30 degrees Celsius (86 degrees Fahrenheit).
As the temperature starts dropping, the relative humidity starts to rise. (As you will discover in the linked article above, air with a warmer temperature can hold more water vapor than the same air at a lower temperature. This simply means the lower the temperature, the higher the percentage of relative humidity.)
Once the temperature drops low enough for relative humidity to reach 100%, dew point is reached. This is the point where the maximum amount of water vapor can be held without condensation taking place. (Also, at 100% humidity, the actual temperature and dew point temperature are also exactly the same.)
If the temperature continues to drop below this level, condensation will take place, and water droplets will start forming.
Please note: The scenario above is just a hypothetical example. Relative humidity DOES NOT need to reach 100% in order for condensation and rain to take place. As long as the actual temperature drops below the dew point temperature with enough water vapor in the air, cloud formation and rain can occur.
Relative humidity is just an indicator of the amount of moisture in the air relative to the actual temperature. It is not uncommon for relative humidity to be below 70% when rainfall occurs.
The exact calculation of dew point is beyond the scope and not the purpose of this article and may be addressed in an upcoming post.
The Relationship Between Dew Point, Relative Humidity And Comfort Level
We all have heard and used the expression, “It’s not the heat, it’s the humidity.” It describes the feeling we get when we become hot and sweaty, even though the thermometer itself does not indicate an abnormally high temperature.
While it is partially true, and humidity does play a big part, the discomfort level we experience is actually better measured by the dew point.
Relative humidity can actually be 100%, yet it may still not be nearly as uncomfortable as a different situation where the relative humidity is around 70%. For this reason, relative humidity is a fairly poor indicator of comfort levels, and dew point is the chosen standard used by meteorologists to describe comfort/discomfort levels.
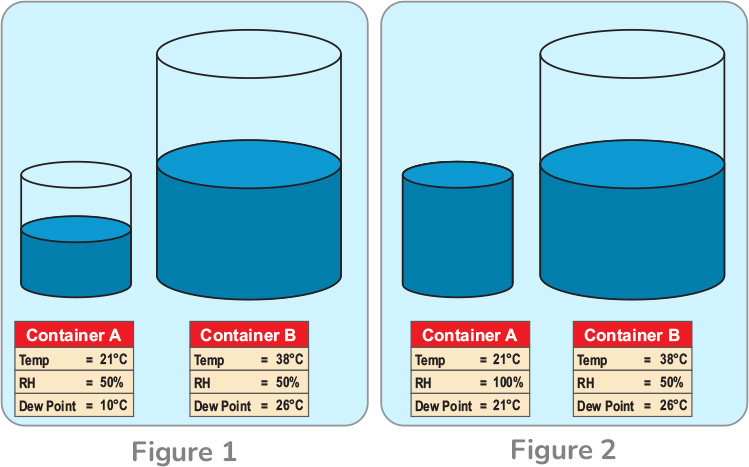
The illustration above will help explain why this is the case.
It is important that you keep in mind that the amount of discomfort or “humidity” you experience is a direct result of the actual amount of moisture in the air. And this is where relative humidity becomes a problem.
Relative humidity is the result of a calculation of the amount of moisture relative to the temperature in the air, not the specific amount of moisture actually present in the air. And this is what makes the dew point temperature a much more accurate and calculated indicator of the discomfort level you are experiencing.
In the illustration above, let’s first take a look at Figure 1 to illustrate this. Both containers measure a relative humidity of 50%. Yet, it is clear that Container B contains much more water vapor than Container A.
Since the temperature in Container B is much higher, allowing the air to hold more moisture, the discomfort level is substantially higher than that in Container A. This is clearly indicated by the much higher dew point temperature of 26° Celsius (compared to the much lower dew point of 10 ° Celsius in Container A).
This point is reinforced in Figure 2. Even if the relative humidity is raised to 100% in Container A, and the air is fully saturated at a dew point of 21° Celsius, it is still below that of Container B, where nothing has changed, and the dew point remains at 26° Celsius as a result.
This means that, in both cases, the level of discomfort in Container B is higher than that of Container A. This is evident as the dew point of Container A, even at 100% relative humidity in Figure 2, is still below the higher dew point of Container B.
This simply shows that the higher temperature in Container B allows the air to contain a greater amount of water vapor, which is clearly reflected by the higher dew point temperatures in the illustration above.
The change from 50% relative humidity to 100%, however, does not necessarily mean that the discomfort level (even at 100% humidity) is as high as the figures may imply. (As illustrated in the diagram above.)
This is a bit of a mind-bender, and it takes a while to wrap your head around it. You may need to reread this part a couple of times to make sense of it all.
Just know that humidity definitely plays a big part in the discomfort levels we sometimes feel, but the actual discomfort level is much better reflected by the dew point temperature than by the relative humidity.
Conclusion
By now, you will have a much clearer picture of what exactly dew point is, how it is formed, as well as its effect on the environment.
We also delved into the more complex relationship between relative humidity and dew point and its role in the level of discomfort we feel.
Until next time, keep your eye on the weather!